Height Comparison: Visual Height Difference Calculator and Proportional Scale Chart
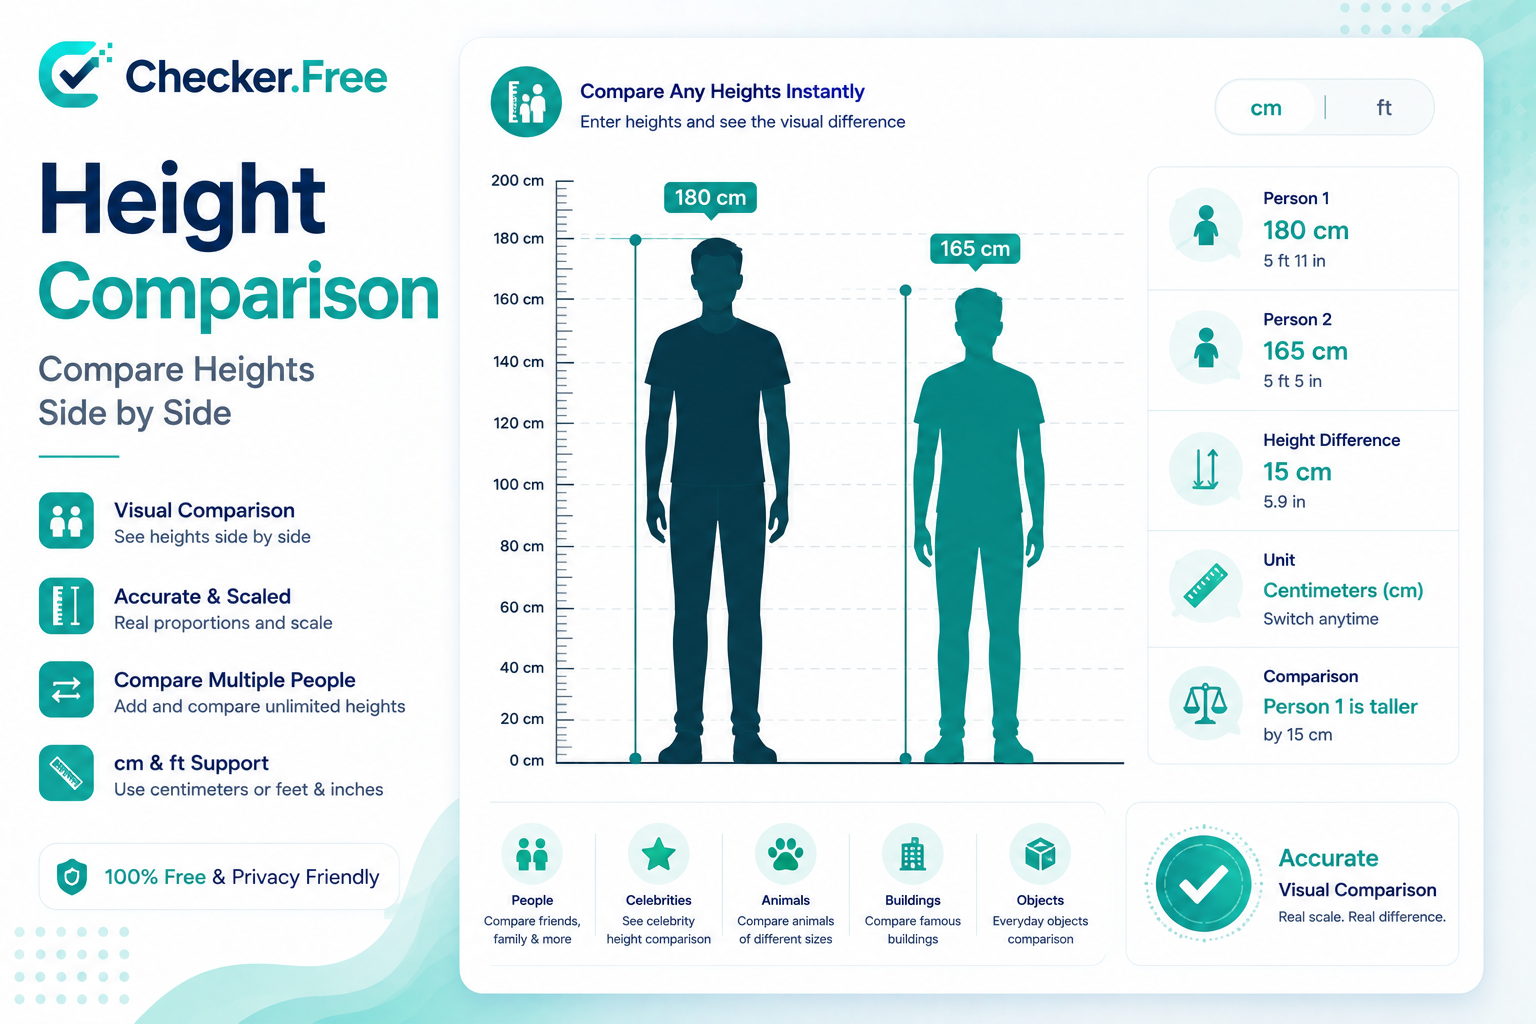
Numbers can tell you that one person is 180 cm tall and another is 165 cm, but they do not always make the physical difference easy to visualize.
The Checker.Free Height Comparison tool turns numerical height measurements into a proportional visual lineup, allowing people, characters, animals, buildings, vehicles, trees, and other objects to be compared on a shared vertical scale. The page is designed for side-by-side visualization, height-difference calculations, unit conversion, rankings, and group statistics.
What Is a Height Comparison Tool?
A visual height comparison tool places two or more subjects on the same vertical reference system so that their relative dimensions can be understood spatially rather than only numerically.
The Checker.Free implementation uses a shared ground baseline and calculates vertical proportions directly from the supplied height values. This means that a 160 cm person and a 5000 cm landmark can appear together while the chart dynamically adjusts its scale.
This is useful because a numerical measurement answers “How tall?”, while a visual comparison also answers “How much taller?” and “What does that difference actually look like?”
Height Difference vs Height Comparison
These two concepts are related but not identical.
Height difference is the numerical gap between two measurements:
Height Difference = |Height A − Height B|
For example:
Person A = 180 cm
Person B = 165 cm

Difference = |180 − 165|
Difference = 15 cm
The Height Comparison tool goes further by placing both values on the same visual scale and allowing additional measurements such as ranking, ratios, averages, medians, and height ranges.
How the Proportional Height Chart Works
The most important principle is a shared ground baseline.
Every subject starts from the same vertical reference point, effectively creating a common y = 0 ground level. The visual height of each item is then determined by the numerical height entered for that subject.
This prevents a common visualization problem: two silhouettes starting at different vertical positions can make identical or different measurements appear misleading.
The chart also supports dynamic scaling, so comparisons can range from ordinary human heights to very large objects without simply pushing part of the chart off-screen.
An Important Limitation
The numerical scale is proportional, but the silhouettes themselves are stylized representations.
That means the chart accurately represents overall height, but it does not claim that two human figures have identical leg length, torso length, shoulder width, posture, or other anatomical proportions.
The visual should therefore be interpreted as a scale comparison rather than as an anatomical reconstruction.
Comparing Centimeters, Feet and Inches
Height is commonly recorded in either metric or imperial units, so the tool provides both input systems.
For centimeters to feet and inches, the calculation first converts centimeters into total inches:
Total Inches = Centimeters ÷ 2.54
The total inches are then divided by 12 to determine feet, with the remainder becoming the inches component.
For the reverse conversion:
Total Inches = (Feet × 12) + Inches
Centimeters = Total Inches × 2.54
For example:
5 ft 10 in
= (5 × 12) + 10
= 70 inches
= 177.8 cm
The page also takes care to avoid common imperial conversion problems such as treating 5' 12" as a separate height instead of correctly carrying it over to 6' 0".
Compare Multiple People at Once
The tool is not limited to a simple two-person comparison.
Multiple subjects can be added to the same comparison stage, then reordered or sorted. The FAQ specifically describes support for people, characters, animals, and objects, with group statistics such as:
Tallest item
Shortest item
Average height
Median height
Height range
This makes the tool useful for group lineups rather than only one-to-one comparisons.
For example, you could create a lineup containing:
Person A
Person B
Person C
Person D
Person E
and then sort the lineup from tallest to shortest.
Height Ranking and Group Statistics
The Height Ranking Table provides a numerical complement to the visual chart.
The table includes the subject's:
Rank
Name
Category
Height in centimeters
Height in feet and inches
Difference relative to the average
The chart also calculates aggregate statistics for the currently visible items.
Average Height
Average height is calculated by adding all measurements and dividing by the number of entries.
For example:
170 + 175 + 180 + 185 = 710

710 ÷ 4 = 177.5 cm
Median Height
The median is the middle measurement after the values have been sorted.
For an odd number of entries, there is one middle value. For an even number, the median is typically the midpoint of the two central values.
The median can be particularly useful when a lineup contains extreme outliers, such as several people combined with a large structure.
Height Range
The height range represents the difference between the tallest and shortest visible item:
Height Range = Maximum Height − Minimum Height
Height Ratio: How Much Taller Is One Subject?
A height ratio provides another way to express relative scale.
The formula is:
Height Ratio = Height A ÷ Height B
For example:
180 ÷ 165 = 1.091
This means the 180 cm subject is approximately 1.091 times the height of the 165 cm subject.
Ratios are especially useful when comparing people with substantially different heights, or when comparing a human to a much larger object.
Percentage Height Difference
A raw 10 cm difference does not represent the same relative change for every person.
Percentage difference can be calculated relative to a chosen reference:
Percentage Difference =
(Difference ÷ Reference Height) × 100
For example, a 15 cm difference relative to a 165 cm reference is:
(15 ÷ 165) × 100
= 9.09%
This explains why identical absolute differences can look proportionally different when comparing people of very different heights.
Comparing Couples, Families and Groups
One of the most obvious applications is comparing people who regularly stand beside one another.
The tool can be used for:
Couples: visualize the difference between two partners.
Families: compare parents, siblings, and children in one lineup.
Friend groups: place several measurements together and sort them by height.
Sports lineups: compare athletes before matches or team events.
The page specifically lists couples, family members, fictional characters, architecture, vehicles, trees, and athletic lineups among its practical use cases.
Comparing Anime and Fictional Characters
Height charts are particularly useful for fictional characters because official character information is often presented numerically rather than visually.
The tool allows official profile or databook heights to be entered into the custom form, after which characters can be placed together on the same proportional chart.
This works well for:
Anime characters
Manga characters
Video game characters
Movie characters
Fictional creatures
Superheroes
Giants and monsters
However, fictional canon can vary between different releases. A character's official height may differ between a manga, anime adaptation, light novel, or game version, so the source of each measurement should be considered.
Comparing Animals With Human Height
Animal measurements require extra care because different species are not always measured in the same way.
For many quadrupeds, height is conventionally measured at the shoulder or withers, while humans are normally measured standing upright.
That distinction matters when building a mixed lineup.
For example, comparing:
Human height
Horse withers height
Dog shoulder height
Bear standing height
can be visually interesting, but the measurements should represent compatible dimensions rather than mixing unrelated conventions.
Comparing Buildings, Vehicles and Objects
The scale chart is not restricted to people.
The page specifically supports comparisons involving buildings, vehicles, trees, and other objects, and automatically adjusts its vertical scale for larger measurements.
This creates many useful comparisons:
Person vs car
Person vs tree
Person vs door
Person vs building
Person vs statue
Person vs aircraft
Person vs furniture
Multiple vehicles
Architectural landmarks
Visual scale becomes especially useful when the difference is too large to understand intuitively from numbers alone.
Adding Custom People and Items
The custom entry form lets you create a new subject with a display name and numerical height.
The page provides two main measurement modes:
Metric: centimeters
Imperial: feet and inches
It also provides selectable model styles, including male silhouette, female silhouette, and generic object.
The interface also supports a custom color for the subject, making large comparison lineups easier to distinguish.
Using the Item Library
In addition to manually entering measurements, the page includes an Item Library.
The library can be searched and filtered by categories, allowing items to be placed directly onto the comparison stage.
This is useful when you want scale anchors rather than building every subject manually.
For example, instead of manually creating a vehicle or animal entry, you can search the library and place the available item directly into the lineup.
Using Your Own Image
The tool also includes an Upload Image function for custom PNG, SVG, JPEG, or WebP imagery.
There is an important limitation, however: uploading a photograph does not automatically determine someone's real-world height.
A photograph has no guaranteed absolute scale because camera distance, focal length, perspective, camera angle, and lens distortion can change apparent size. The uploaded image is therefore scaled using the real-world height value supplied by the user.
So the correct workflow is:
1. Determine the real height.
2. Enter the real measurement.
3. Upload the visual representation.
4. Let the chart scale the image according to that measurement.
For image-related work, Checker.Free also provides an Image Resolution Checker for inspecting image dimensions.
Measuring Your Height More Accurately
A visual comparison is only as reliable as the measurement entered into it.
For a more consistent home measurement, the page recommends:
Remove footwear.
Stand barefoot on a hard, level floor.
Stand against a flat wall.
Keep your heels, buttocks, and upper back aligned against the wall where practical.
Look straight ahead using the Frankfort plane.
Place a flat right-angle object firmly on top of the head.
Mark the wall.
Measure vertically from the floor using a non-stretch tape measure.
Posture also matters. Slouching, bent knees, pelvic position, and footwear can alter standing height measurements.
Why Height Can Change During the Day
It is normal for measured height to vary slightly between morning and evening.
During sleep, the intervertebral discs decompress and absorb fluid. Normal daily activity and gravity then create compression during the day.
That means measurements taken at different times should not automatically be assumed to represent a measurement error.
For comparisons where consistency matters, record the measurement conditions along with the numerical height.
Why Celebrity Heights Can Differ Between Sources
Celebrity and athlete heights sometimes appear inconsistent across websites.
The page identifies several possible reasons:
Self-reported estimates
Shoes versus barefoot measurements
Sports measurements taken under specific conditions
Metric-to-imperial rounding
Outdated agency or profile information
When building a celebrity height comparison, it is therefore useful to keep the source of each value consistent rather than mixing several unrelated databases.
Is a 5 cm Height Difference Noticeable?
A 5 cm difference can generally be noticeable when two people stand side by side under comparable conditions, but visual perception can be affected by posture, hairstyle, footwear, and other factors.
This is another reason proportional charts are useful: instead of relying on memory or photographs, both measurements can be placed against the same baseline.
Why the Same 10 cm Difference Can Look Different
Suppose one person is 150 cm and another is 160 cm.
The difference is 10 cm.
Now compare 190 cm and 200 cm.
The difference is still 10 cm.
But the relative difference is not identical:
10 ÷ 150 = 6.67%

10 ÷ 200 = 5.00%
The page uses this example to illustrate why the same absolute difference can represent a different proportion of total height depending on the reference measurement.
This is where height ratios and percentage comparisons become useful alongside the visual chart.
Exporting a Height Comparison
The comparison chart is not limited to viewing.
The export system supports:
PNG at standard 1× resolution
High-resolution 2× PNG
Ultra 3× PNG
SVG vector export
Formatted summary data
CSV ranking-table export
SVG is particularly useful when a chart needs to be resized without the same raster scaling limitations as a PNG image.
The ranking table can also be exported as CSV, which is useful for keeping a numerical record of a larger comparison set.
Sorting and Organizing the Lineup
Once several subjects have been added, the lineup can be reorganized using different sorting modes.
Available options include:
Manual Order
Tallest → Shortest
Shortest → Tallest
Name A → Z
Name Z → A
Manual ordering is useful for storytelling or visual presentation, while height-based sorting is better for creating an objective ranking.
Zoom, Labels, Guides and Reference Lines
The chart includes controls designed for detailed visual inspection.
You can adjust:
Zoom level
Fit-to-screen view
Grid lines
Labels
Selection guides
Reference line
Fullscreen mode
The comparison toolbar also includes undo and redo controls, making interactive editing easier when building a complex lineup.
A reference line can be useful when you want a common visual anchor across several subjects, while labels help identify names and measurements directly on the chart.
A Practical Height Comparison Workflow
For a clean and repeatable comparison, use this process:
1. Collect reliable height measurements.
2. Keep the measurement convention consistent.
3. Add preset subjects or create custom entries.
4. Choose centimeters or feet/inches.
5. Add additional items from the library.
6. Arrange or sort the lineup.
7. Select two subjects for a direct height-difference calculation.
8. Review ratio and group statistics.
9. Inspect the proportional chart.
10. Export the finished comparison as PNG, SVG, or CSV.
This produces both a visual result and a numerical summary.
Height Comparison Is More Than a Simple Calculator
A traditional height calculator gives you a difference such as 15 cm.
A visual comparison adds context.
You can see who is taller, how the difference appears relative to both subjects, how several people rank against one another, how an object compares to a human, and how the same measurement behaves when represented as a ratio or percentage.
That is the main purpose of the Checker.Free Height Comparison tool: combine exact numerical measurements with a proportional visual representation rather than treating height as a single isolated number.
For other measurement and display-related utilities, explore the Checker.Free tools collection or use the Resolution Checker when your project also involves screen dimensions and display measurements.
Comments
Post a Comment